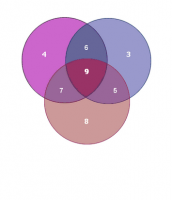


A Venn diagram or set diagram is a diagram that shows all possible logical relations between a finite collection of different sets. Venn diagrams were conceived around 1880 by John Venn. They are used to teach elementary set theory, as well as illustrate simple set relationships in probability, logic, statistics, linguistics and computer science.
In 1886, Venn published The Logic of Chance, a groundbreaking book which espoused the frequency theory of probability, offering that probability should be determined by how often something is forecast to occur as opposed to “educated” assumptions. Venn then further developed George Boole's theories in the 1881 work Symbolic Logic, where he highlighted what would become known as Venn diagrams.
These graphics were pictorial representations of the relationships between sets, with similar diagrams having been used by Gottfried Leibniz and Leonhard Euler. Though quite complex in their orientation and application, Venn diagrams have become a trademark tool over the years in the teaching of introductory math and logic as well as being used by popular media to illustrate relationships between groups and concepts. (For Venn’s 180th birthday, Google created a doodle illustrating said diagrams.)
The diagrams that bear his name were introduced by Venn as a means of depicting relations of inclusion and exclusion between classes, or sets. They consist of two or three intersecting circles, each representing a class and each labeled with an uppercase letter. Lowercase x’s and shading are used to indicate the existence and nonexistence, respectively, of some (at least one) member of a given class.
Two-circle Venn diagrams represent categorical propositions, the basic forms of which are: “All A are B,” “No A are B,” “Some A are B,” and “Some A are not B.” Three-circle diagrams (in which each circle intersects the other two) represent syllogisms, an ancient form of deductive argument consisting of two categorical premises and a categorical conclusion.